

FeaturesServer monitoring
See how your servers are being used.
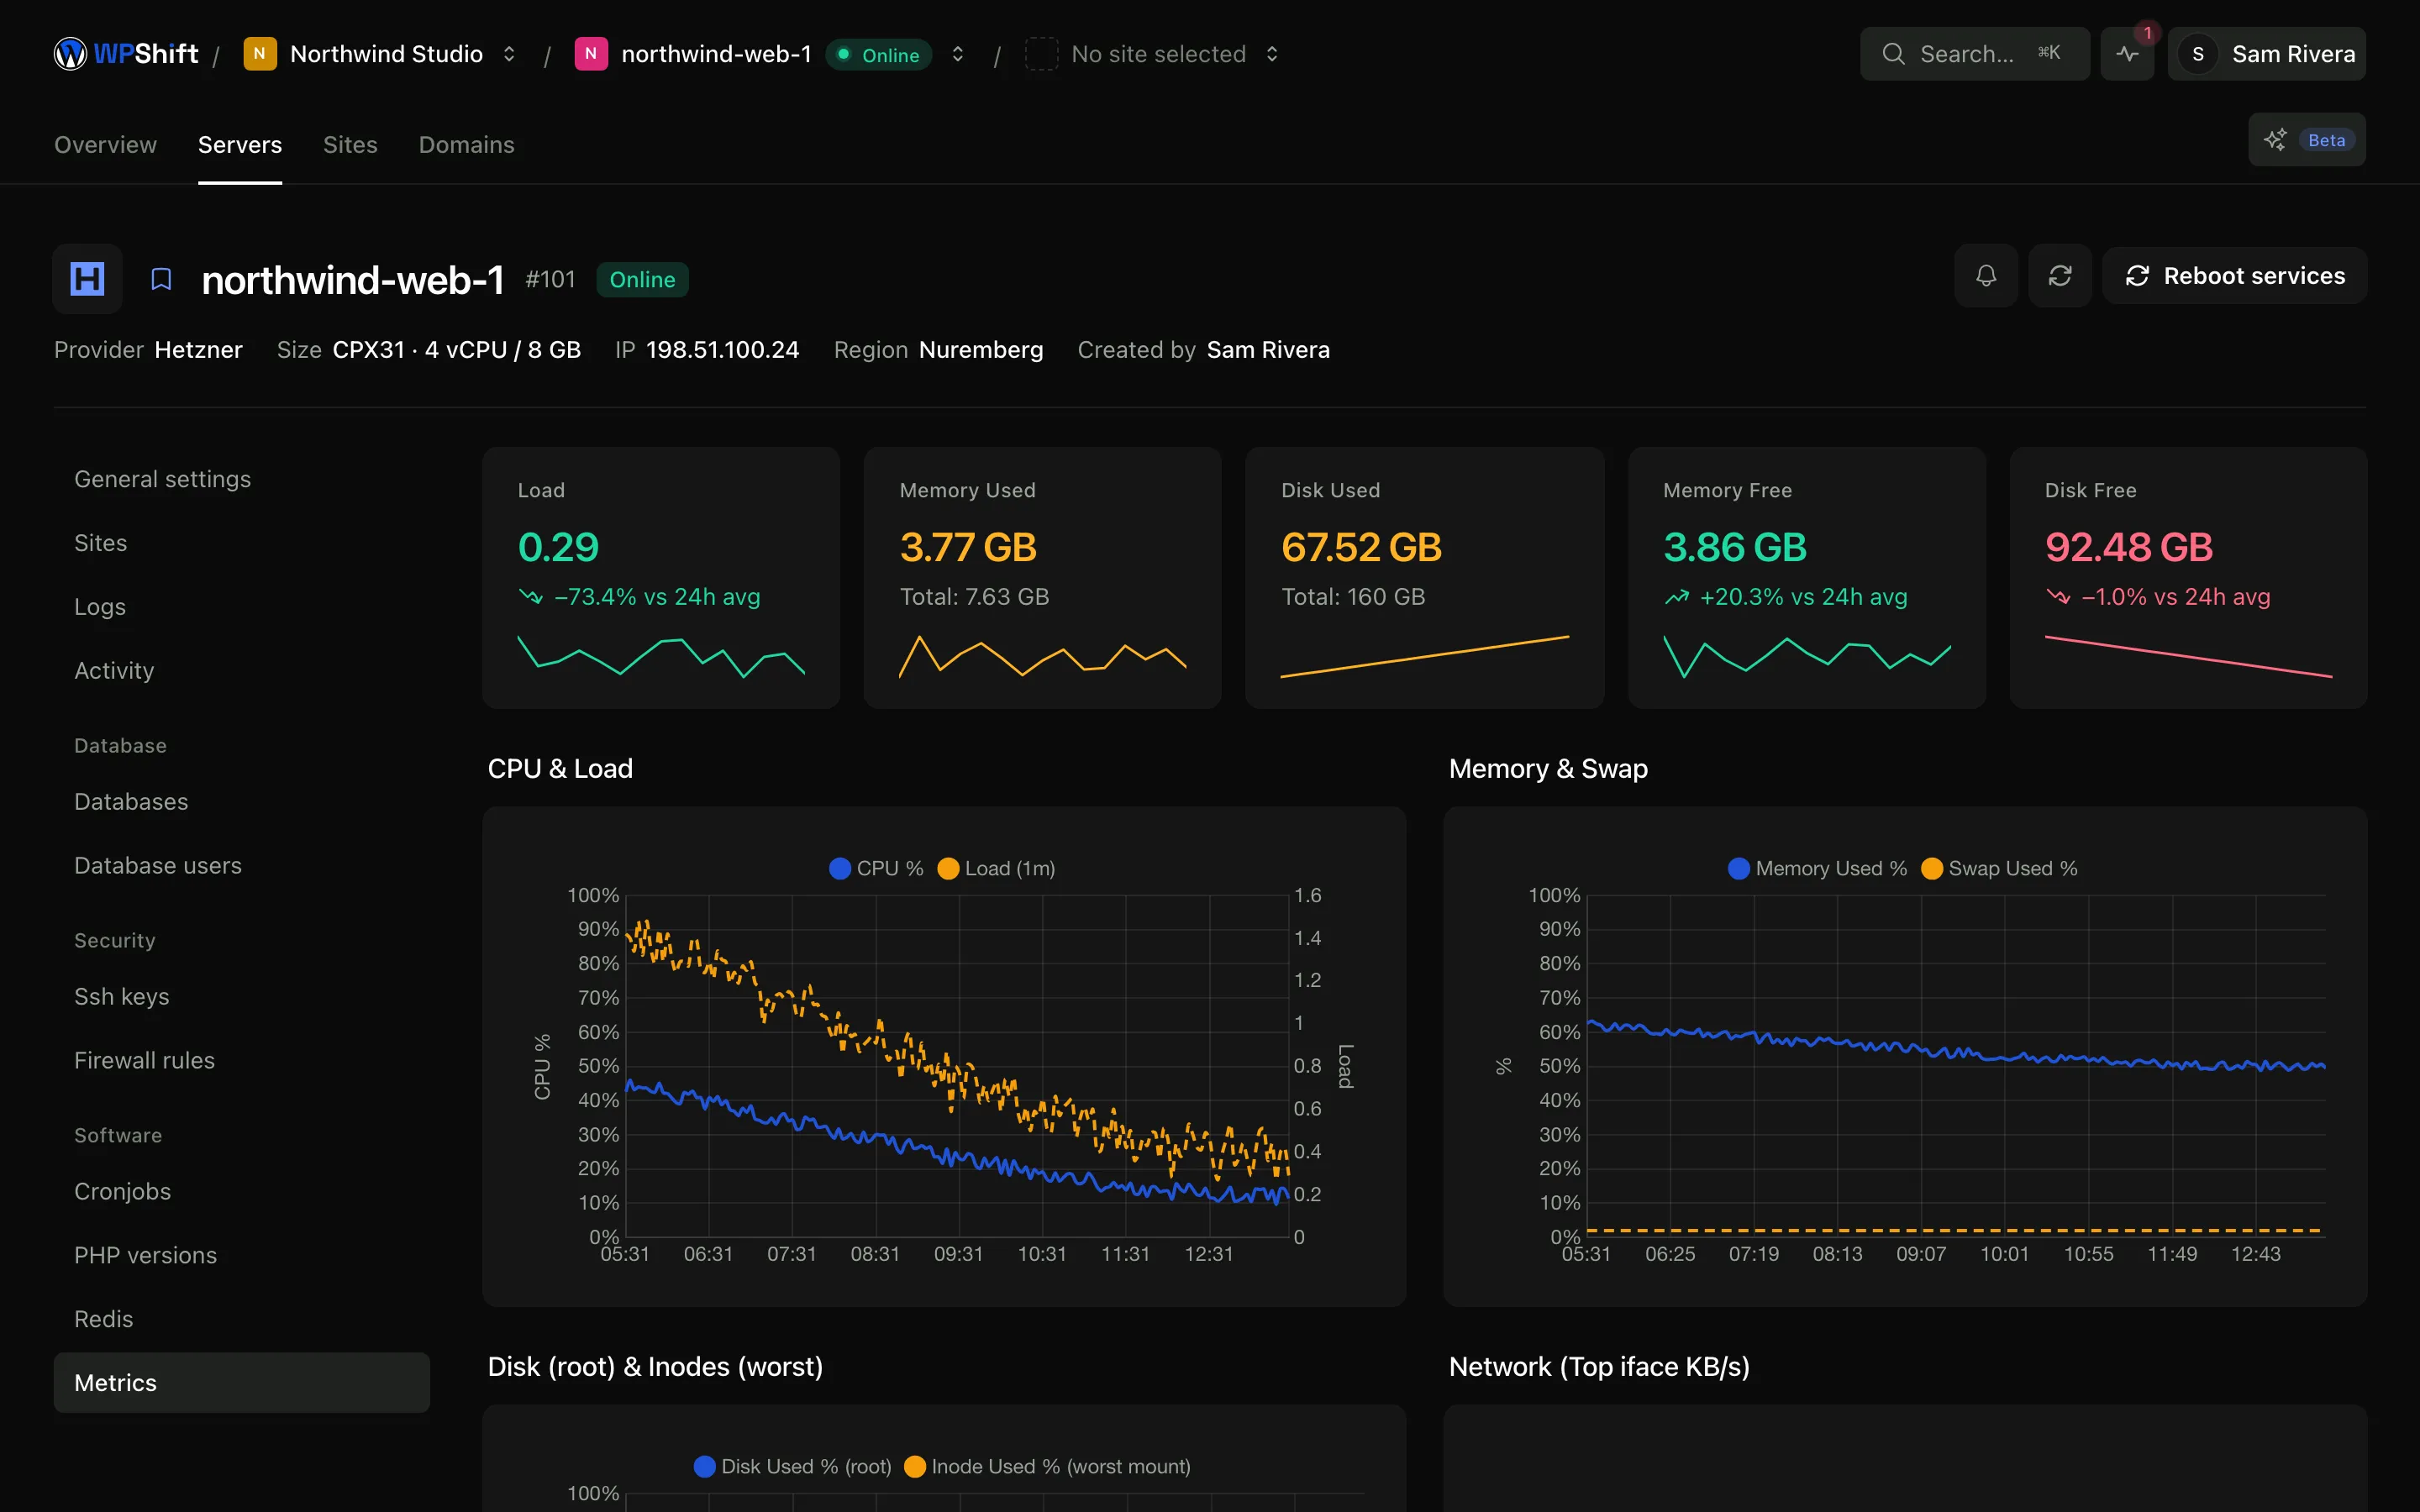
WPShift records CPU, memory, disk usage and load for every server it manages, and keeps the history. The current reading tells you what is happening now; the charts tell you what has been building.
Free plan available. Features vary by plan. Server costs are separate.
How it works
- Step 1
Collected continuously
Readings are taken on a schedule rather than when you happen to open the page, so there is always a history to look back at.
- Step 2
Charted per server
One server on its own when you know which to look at, or every server together when you do not.
- Step 3
Kept over time
A single reading is a snapshot. The same measurement over a fortnight is something you can plan around.
Four measurements worth watching
Disk usage that climbs steadily has a date at which it runs out, and you can work that date out. Memory that never returns to its previous level after a change is worth investigating. Sustained load overnight, when few people are visiting, suggests work you did not ask for. Short CPU peaks are usually the least interesting of the four.
Compare your servers against each other
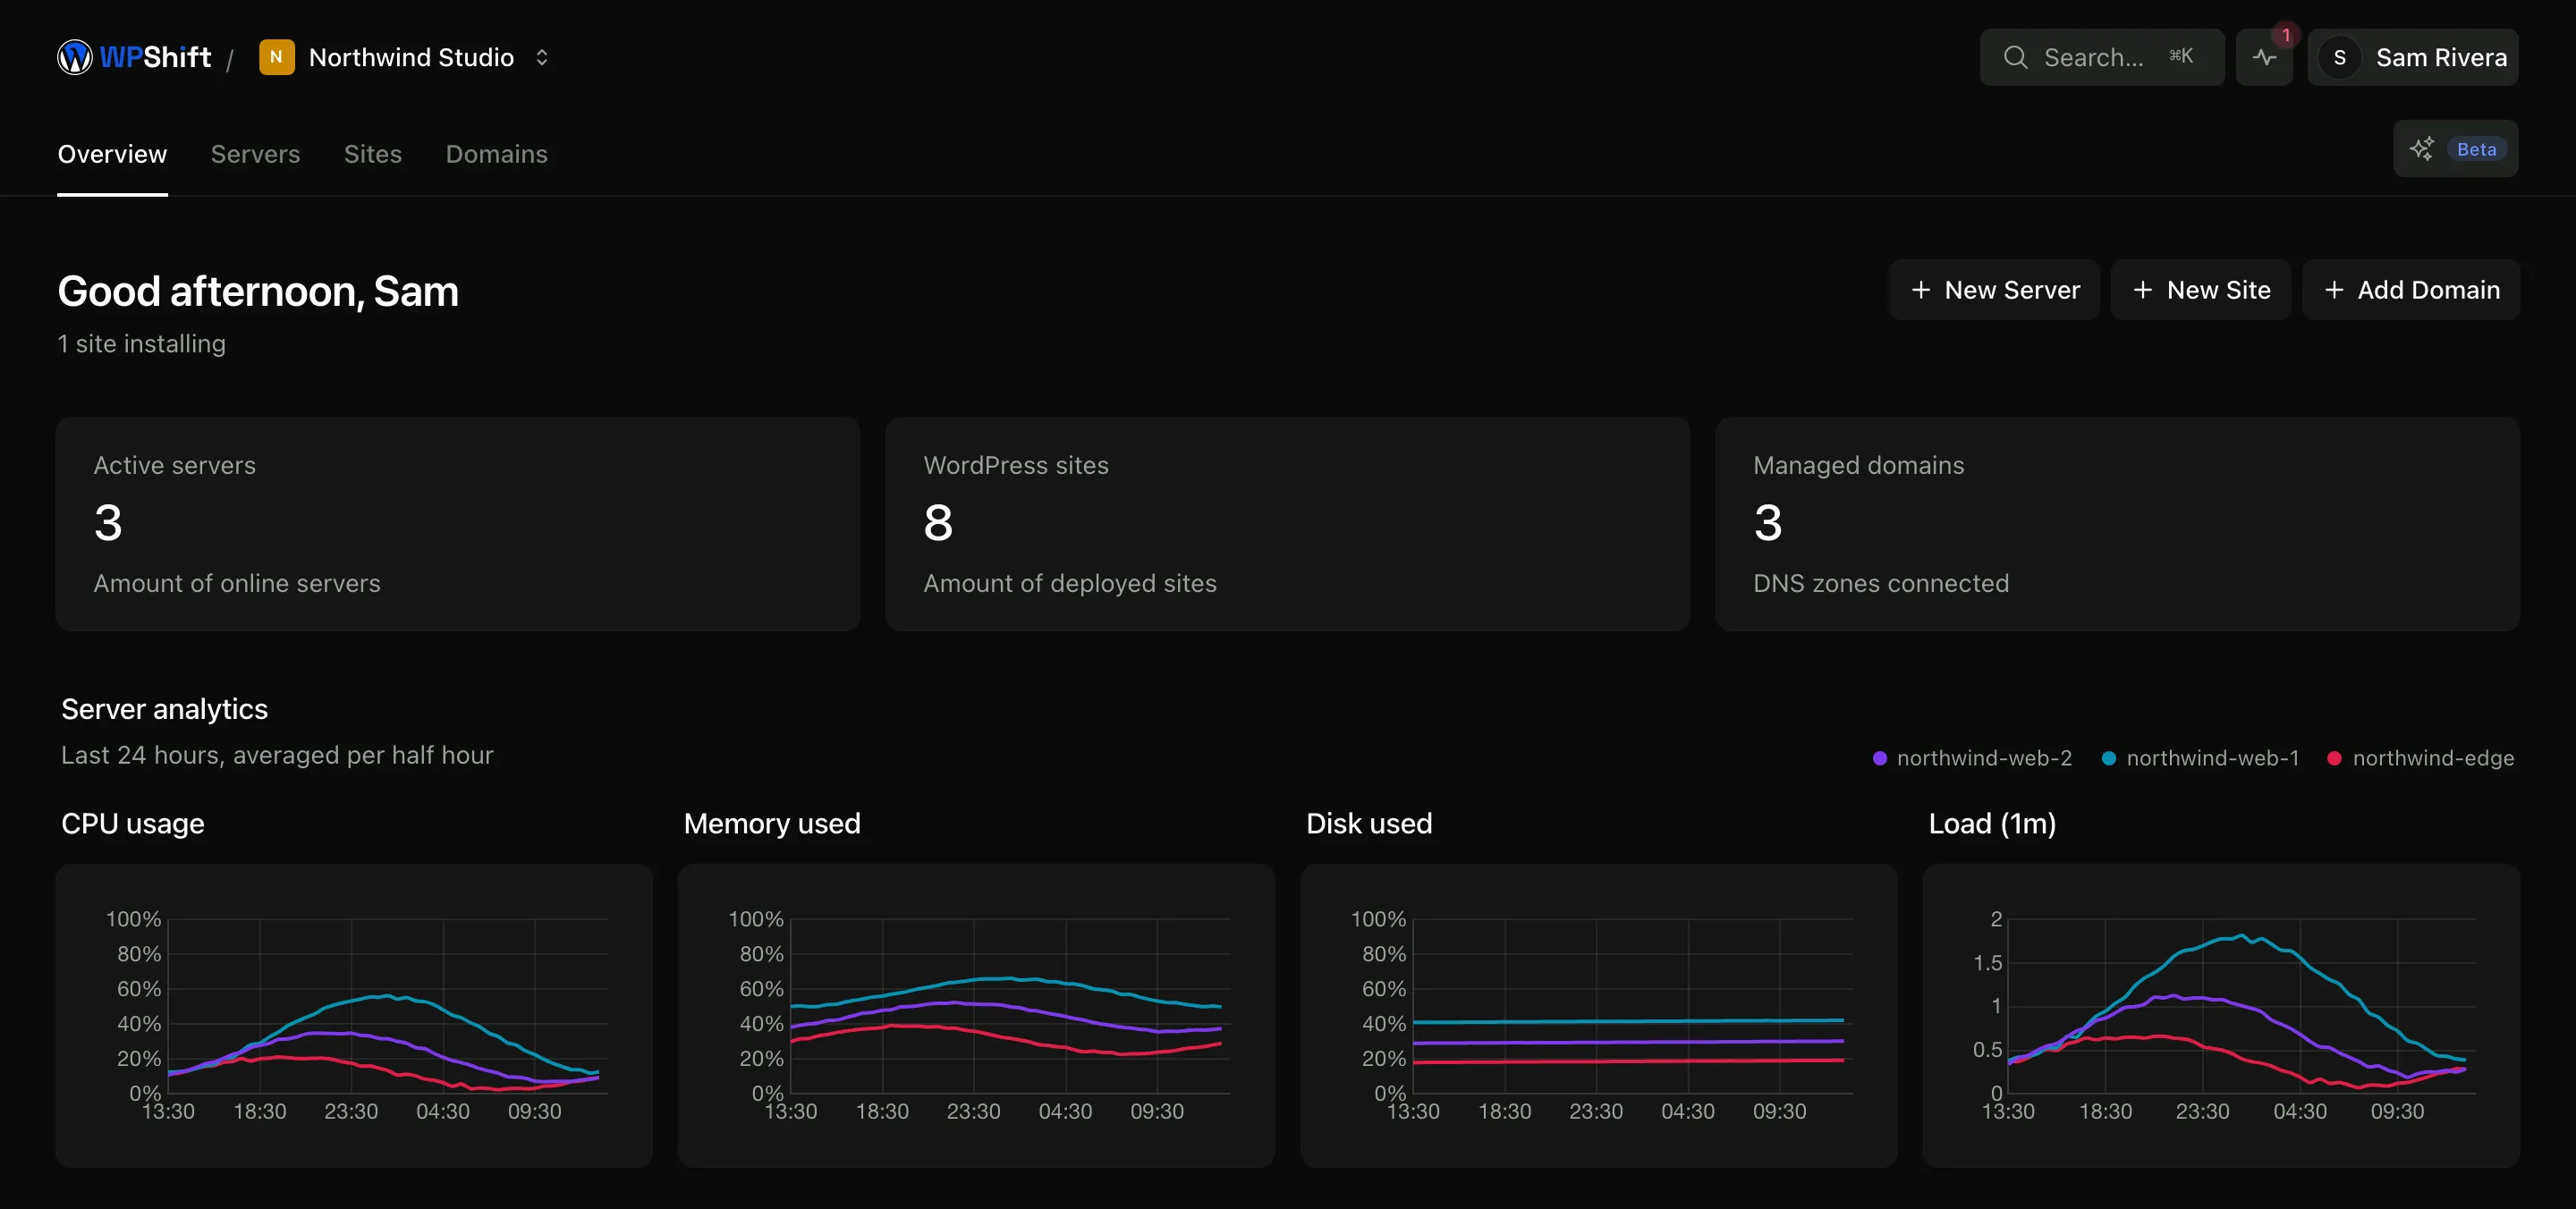
Putting every server on one chart shows where capacity is free and where it is not. That is the information you want before moving a site between servers or resizing one of them.
Read it alongside the rest of the record
Resource charts sit next to uptime results, backups, certificate renewals and the record of operations that ran. When a site slowed down, you can see what else was happening at the same time instead of lining up two systems by hand.
Answer capacity questions with evidence
When a client asks whether they need a bigger server, the usage history answers it in either direction. Both answers are more useful than an estimate.
Common questions
Do I need to install an agent on the server?
No. Readings are collected over the connection WPShift already has to the server. There is nothing to install or keep updated.
How often are measurements taken?
Server metrics are collected on a short cycle, roughly once a minute. The charts show the last 24 hours by default, with longer history behind them.
Is this the same as uptime monitoring?
No. Server metrics describe resource use on a server you manage. Uptime monitoring checks from outside whether a site responds. They are separate checks, configured separately, and they answer different questions.
Will this tell me which plugin caused a change?
Not on its own. The charts show when the server's behaviour changed, which narrows down where to look: the site's plugin and theme list, its logs, and the record of what ran around that time.
Can I see usage per site?
Disk usage and bandwidth are recorded per site. CPU and memory are recorded per server; because each site runs under its own system user, that is what you would use to attribute them on the server itself.
Keep reading
- Uptime monitoringCheck whether sites respond, keep the history, and get an alert when checks fail.
- Cloud serversConnect your cloud account and let WPShift install and configure the server for WordPress.
- AI CopilotInvestigate a question about your setup using your own resources and operation records.
- CachingReduce repeated work with server-level page caching and a Redis object cache.
Set up your first WordPress server
Connect your cloud account, let WPShift prepare the server, and add a site.
Free plan available. Paid plans include a 7-day trial. Server costs are separate.